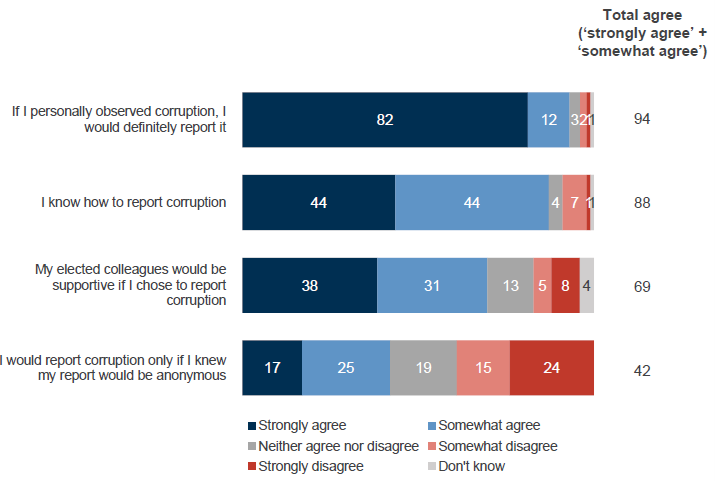
Most Councillors agree that they know what behaviour constitutes corruption.
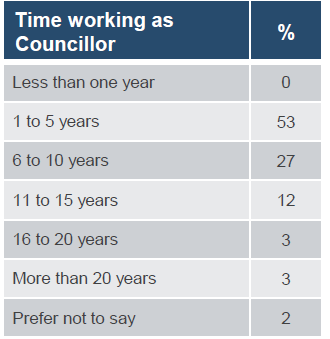
Ninety-four per cent agree that they know what behaviour constitutes corruption, five per cent neither agree nor disagree and two per cent strongly disagree. Perceived understanding is higher among those who have been in elected positions for longer – all respondents who have been a Councillor for six or more years agree they know what behaviour constitutes corruption compared to 88 per cent of Councillors who have served for five years or less.
Councillors are more likely to agree they know what behaviour constitutes corruption compared to MPs (93%) and local government employees (90%).
Councillors value honesty and integrity.
This is evidenced by the almost universal agreement that ‘behaving with honesty and integrity is important to me’ (99% agree, including 98% who strongly agree).
Councillors agree that corruption happens, although fewer agree it is a problem among elected officials.
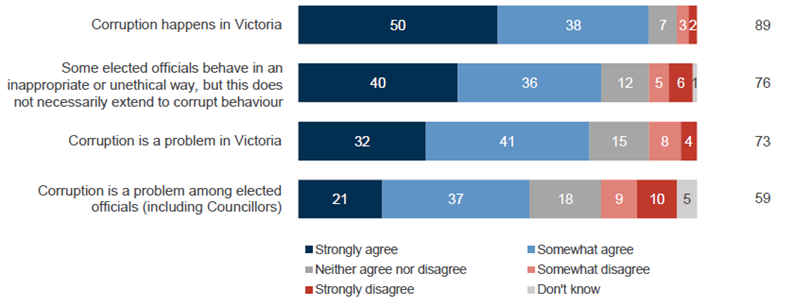
Councillors were asked a series of questions to understand to what extent they believe corruption happens and is a problem.
- Overall, 89 per cent agree that corruption happens in Victoria and almost three in four (73%) agree that corruption is a problem in Victoria. Councillors (73%) are more likely than MPs (68%) and local government employees (62%) to think corruption is a problem in Victoria.
- Fewer Councillors (59%) agree that corruption is a problem among elected officials (including Councillors), but only 10 per cent strongly disagree that it is a problem among elected officials.
- There is however a high level of agreement (76%) that some elected officials behave inappropriately or unethically although not necessarily corruptly. Respondents who have served as a Councillor for 5 years or less were more likely to disagree with this statement (16%) compared to Councillors who have served for six or more years (5%).
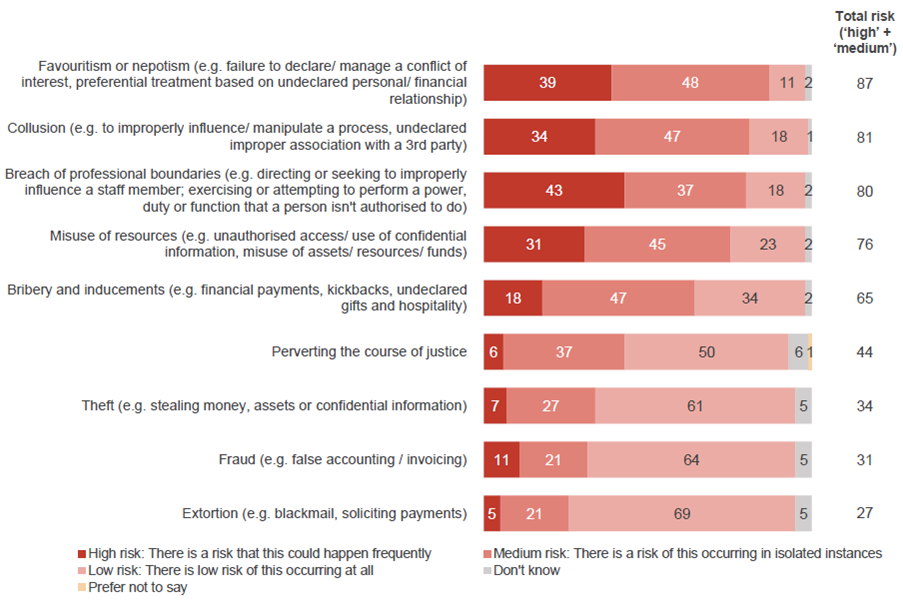
Favouritism, breaches of professional boundaries and collusion are viewed as the most common risks facing Councillors.
Councillors were asked to describe (through an open response question) the most significant ways in which elected representatives in their Council might be vulnerable to corruption. More than four in five respondents identified at least one vulnerability. The key areas identified include a conflict of interest, bribery or fraud or political interference. Comments also focus on breaches of confidentiality, inexperience and ignorance, as well as bullying and harassment.
The top three improper behaviours that Councillors perceive to be a high risk of occurring are favouritism or nepotism, collusion, and breaches of professional boundaries – over 80 per cent of Councillors identified these behaviours as a high or medium risk. Around forty per cent considered a breach of professional boundaries (43%) or favouritism or nepotism (39%) to be a high risk.
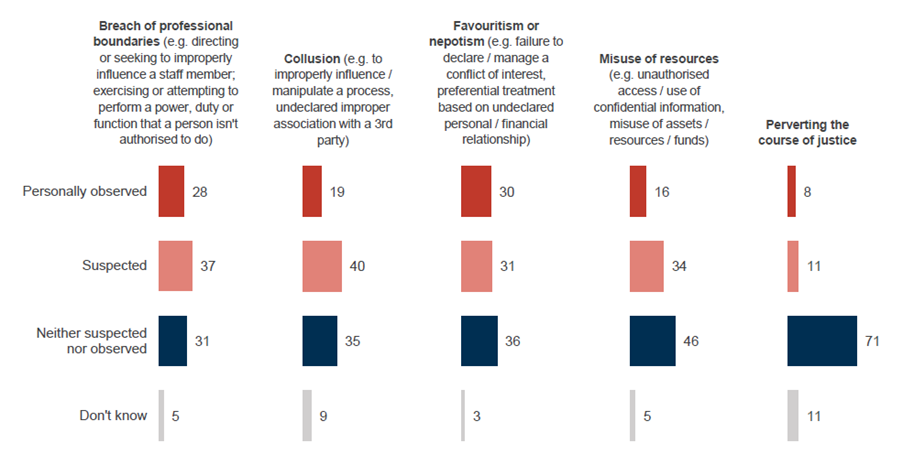
The extent to which Councillors had personally observed or suspected that improper behaviours are occurring in their Council varied by type of behaviour.
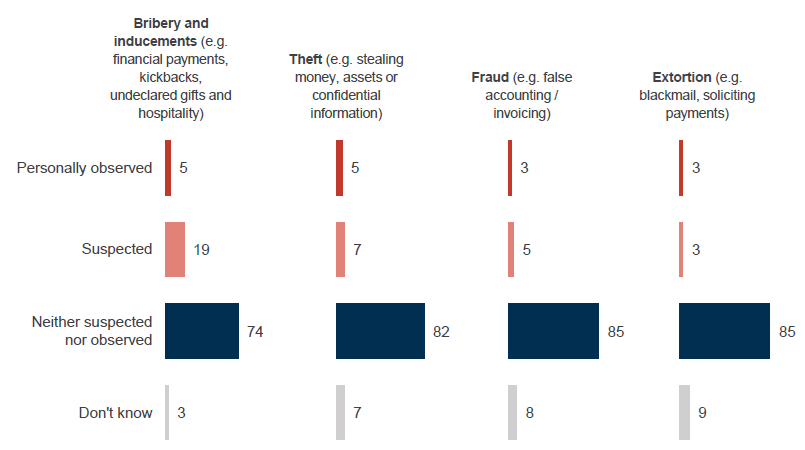
Almost a third of Councillors (30%) have personally observed instances of favouritism or nepotism in the last 12 months at their Council and 31 per cent suspect this has occurred. More than a quarter (28%) have personally observed a breach of professional boundaries and 37 per cent suspect this has occurred. Fewer Councillors have suspected or observed occurrences of bribery, theft, fraud or extortion within their Council. Councillors under the age of 55 years are more likely than those aged 55 years and over to have personally observed favouritism/nepotism (38% compared to 22%) and collusion (28% compared to 8%).
Generally speaking, Councillors are more likely than other cohorts to have personally observed these behaviours compared to MPs or local government employees. For example, 64 per cent have personally observed or suspected a breach of professional boundaries compared to 39 per cent of MPs and 37 per cent of local government employees.
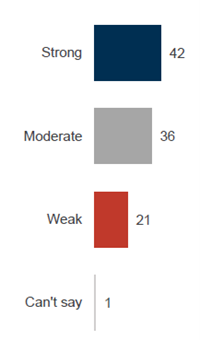
Councillors typically describe the ethical culture among elected local Councillors in their Council as ‘strong’ or ‘moderate’.
Over three quarters of Councillors describe the ethical culture of their local Council as ‘strong’ or ‘moderate’. Among those who ‘agree’ that ‘corruption is a problem among elected officials (including Councillors)’, there is a higher than average incidence of rating the ethical culture of their Council as weak (30% compared to 21% on average). Councillors (21%) were more likely than MPs (11%) and local government employees (12%) to rate the ethical culture as ‘weak’.
Councillors expressed a range of views regarding the ethical culture of their Council. Among those who consider their culture is ‘strong’, reasons include respect, teamwork, peer accountability, open discussions and transparency. Those who rate the ethical culture as ‘weak’ describe self-interest and personal agendas as undermining ethical values and culture, eroding the moral fabric of Council.
The factors that determine an ethical culture are to some degree influenced by an individual’s tolerance threshold. Individual ethical and moral values determine what is acceptable behaviour.
More experienced, multi-term Councillors tend to have a different perspective of culture and the ‘opportunities’ to ‘behave unethically’. First-term Councillors, particularly those who are very early into their term, have an understanding of overtly corrupt behaviour but not necessarily the ‘shades of grey’ of unethical behaviour. First-term Councillors can be unaware that unethical or corrupt behaviour is occurring.
Some Councils have worked as a team to formulate a code of conduct, and the values and expectations of the Council. This consultative approach appears to result in ensuring ethical behaviour and harmonious workings of the Councillors. Working on the culture is ongoing at these Councils.
The availability of an organisation or a help line that Councillors could contact for advice about unethical and corrupt behaviour was suggested as a tool that would be valuable. There is evidence that some Councillors can at times feel isolated and in need of independent advice. A place where issues can be discussed without judgement, separate to Council and IBAC, was proposed.
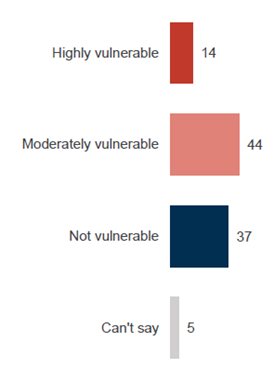
The majority believe their Council is ‘moderately’ or ‘highly’ vulnerable to corruption.
When asked to consider the ethical culture, internal controls and any specific risks that the Councillors perceives relevant, 58 per cent of Councillors identified their Council as highly or moderately vulnerable to corruption. More than a third of Councillors (37%) rate their Council as ‘not vulnerable’ to corruption.
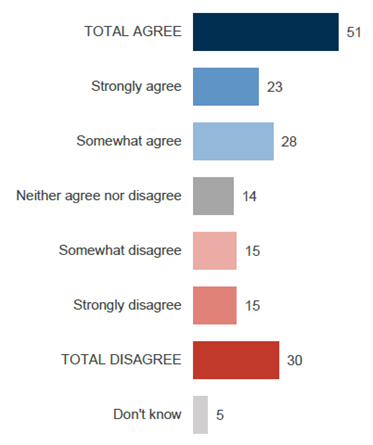
Definite guidance can be lacking when advice is sought on corruption
Half of Councillors (51%) agree that it is difficult to obtain definite guidance when seeking advice on corruption compared to thirty per cent who disagree.
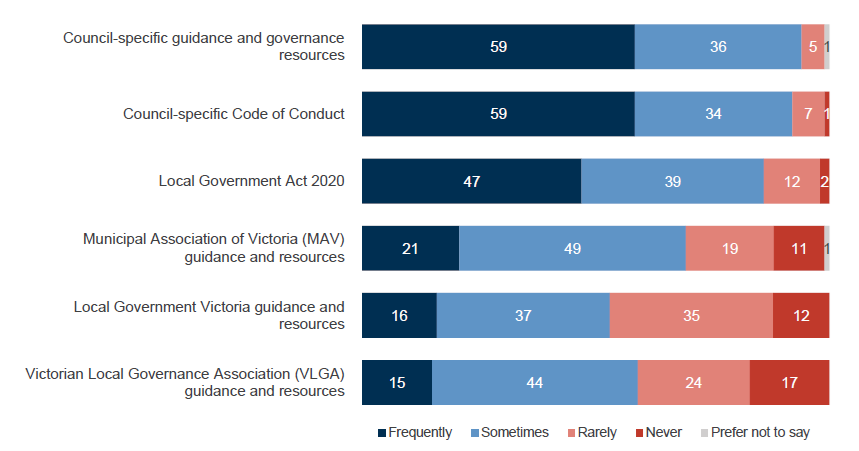
Most Councillors frequently use Council-specific resources to better understand their role and conduct expectations.
Internally developed Council-specific guidance and governance resources and Council’s own Code of Conduct are most frequently used by Councillors to understand their role and conduct expectations.